")
Adding Images as a Data Source in Looker Studio
Looker Studio offers a powerful way to visualise and analyse your data. But what if you want to go beyond numbers and charts and include images? Looker Studio allows you to incorporate images directly into your reports as a data source, adding a whole new dimension to your storytelling. Here we have used it as part of a “Character Catalogue” using Animal Crossing data available on kaggle.com, but there are so many use cases for this!
Here’s how to add your images as a data source in seven simple steps:-
-
-
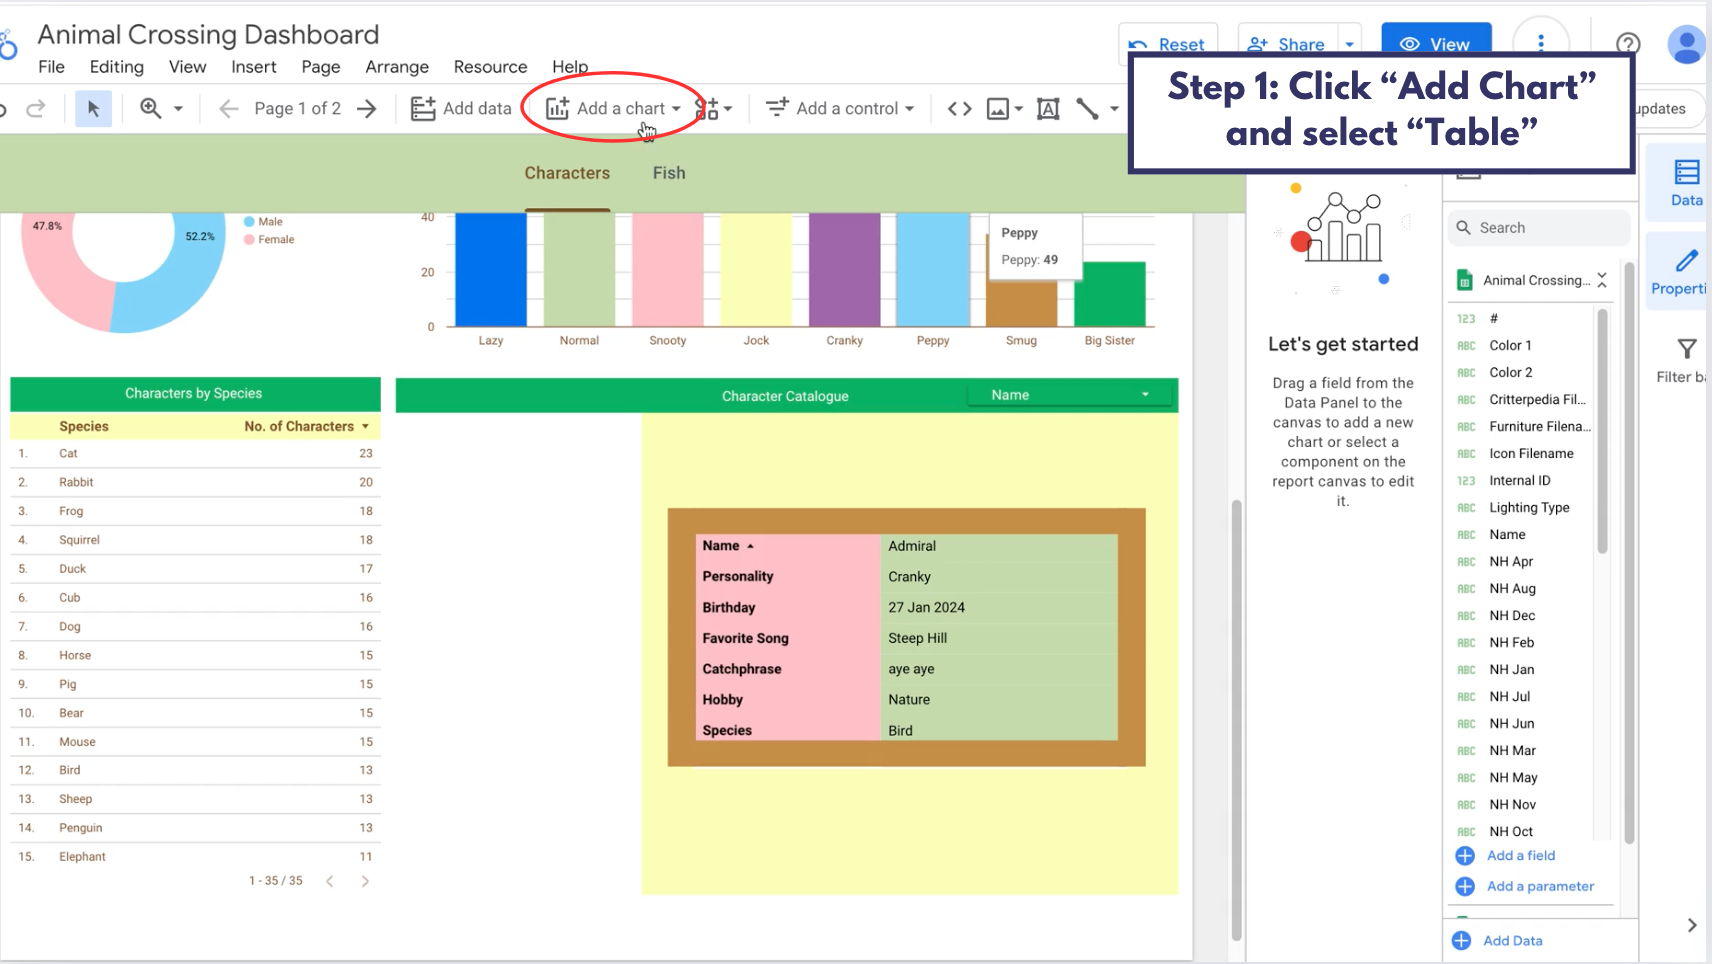
Click “Add Chart” and choose “Table.”
-
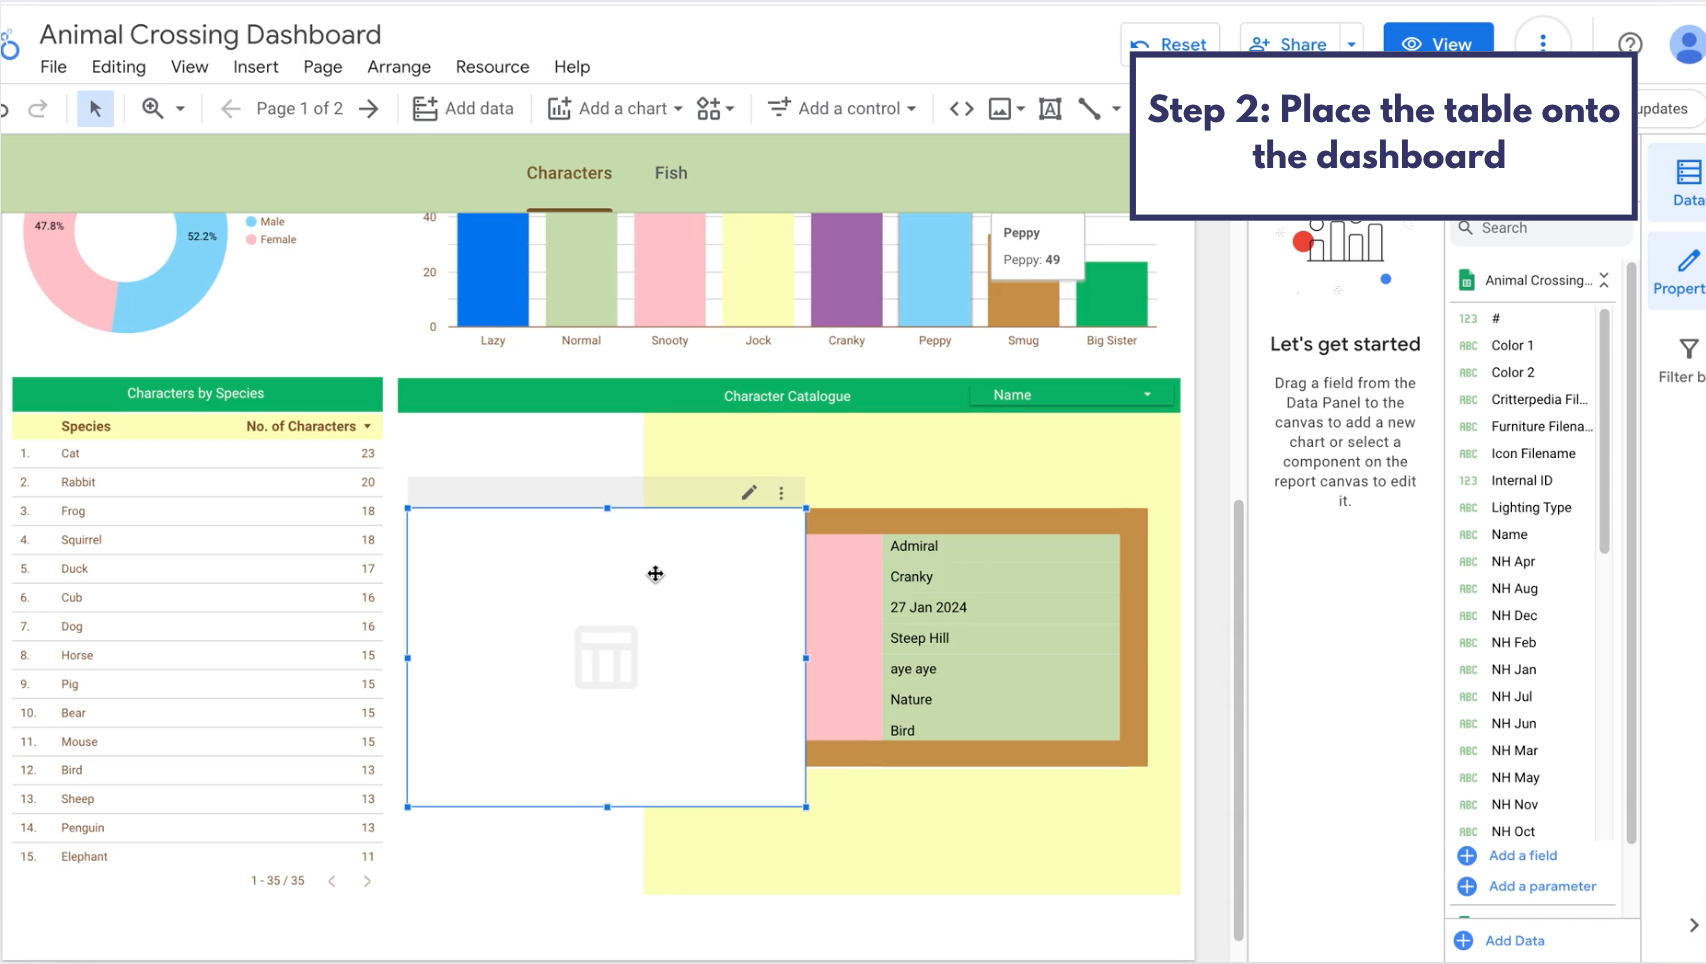
- Place the table onto your dashboard.
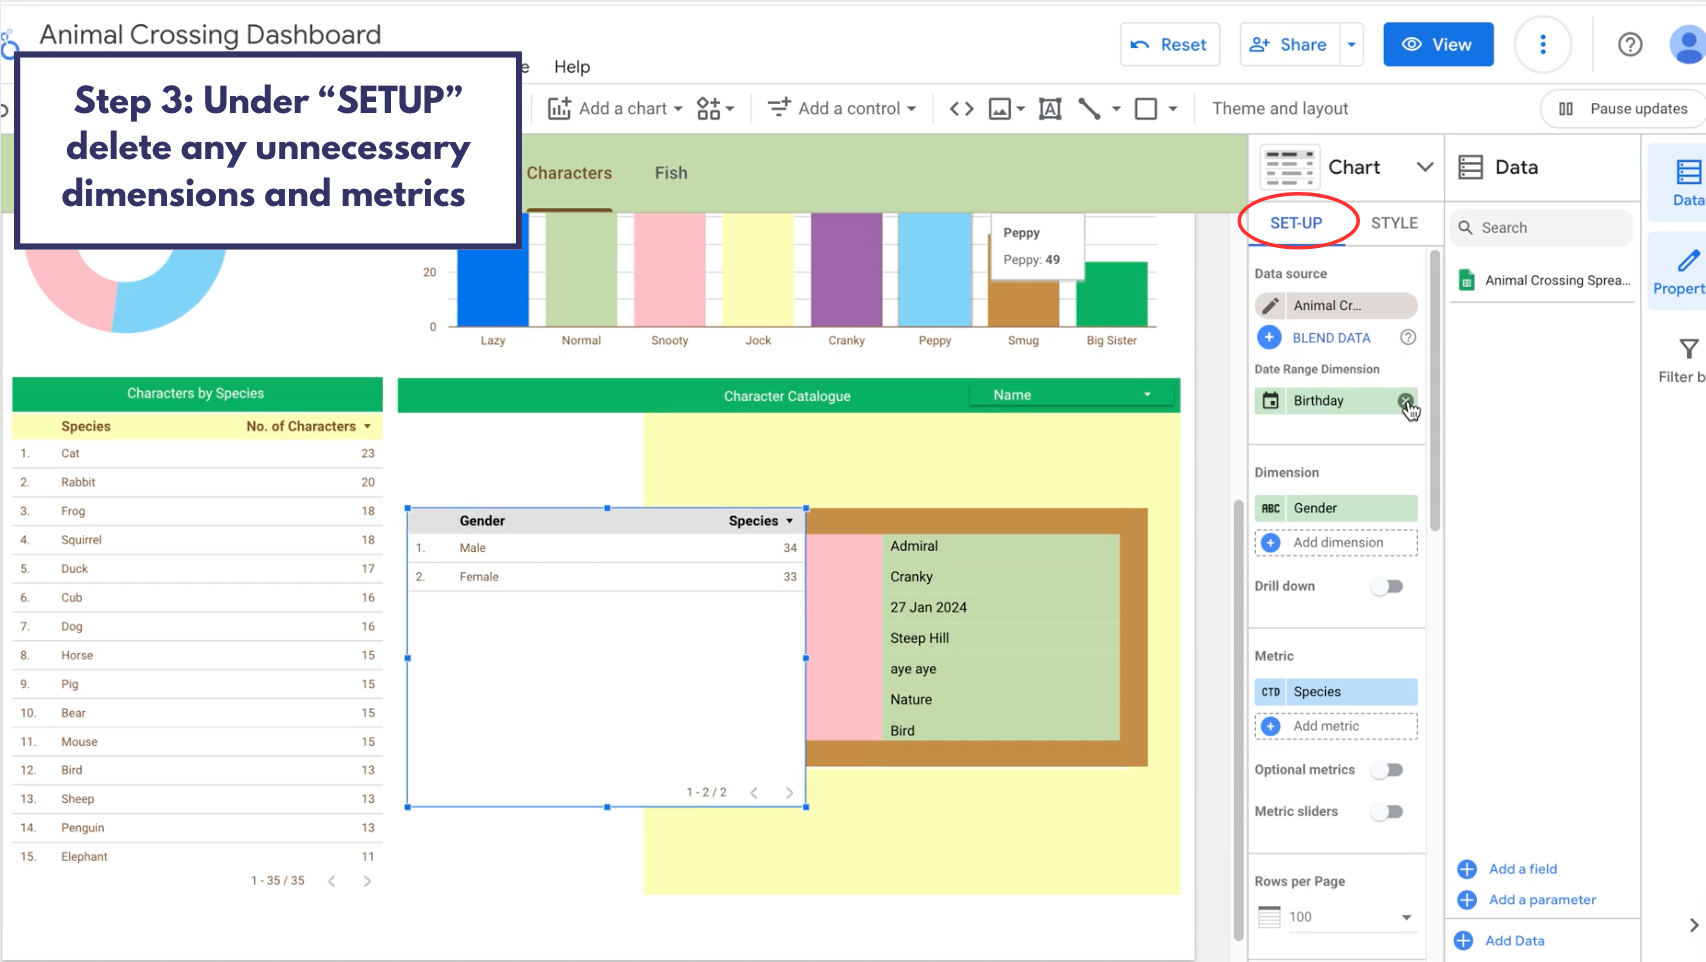
- In the chart settings tab under “SET-UP” delete any unnecessary dimensions and metrics.
-
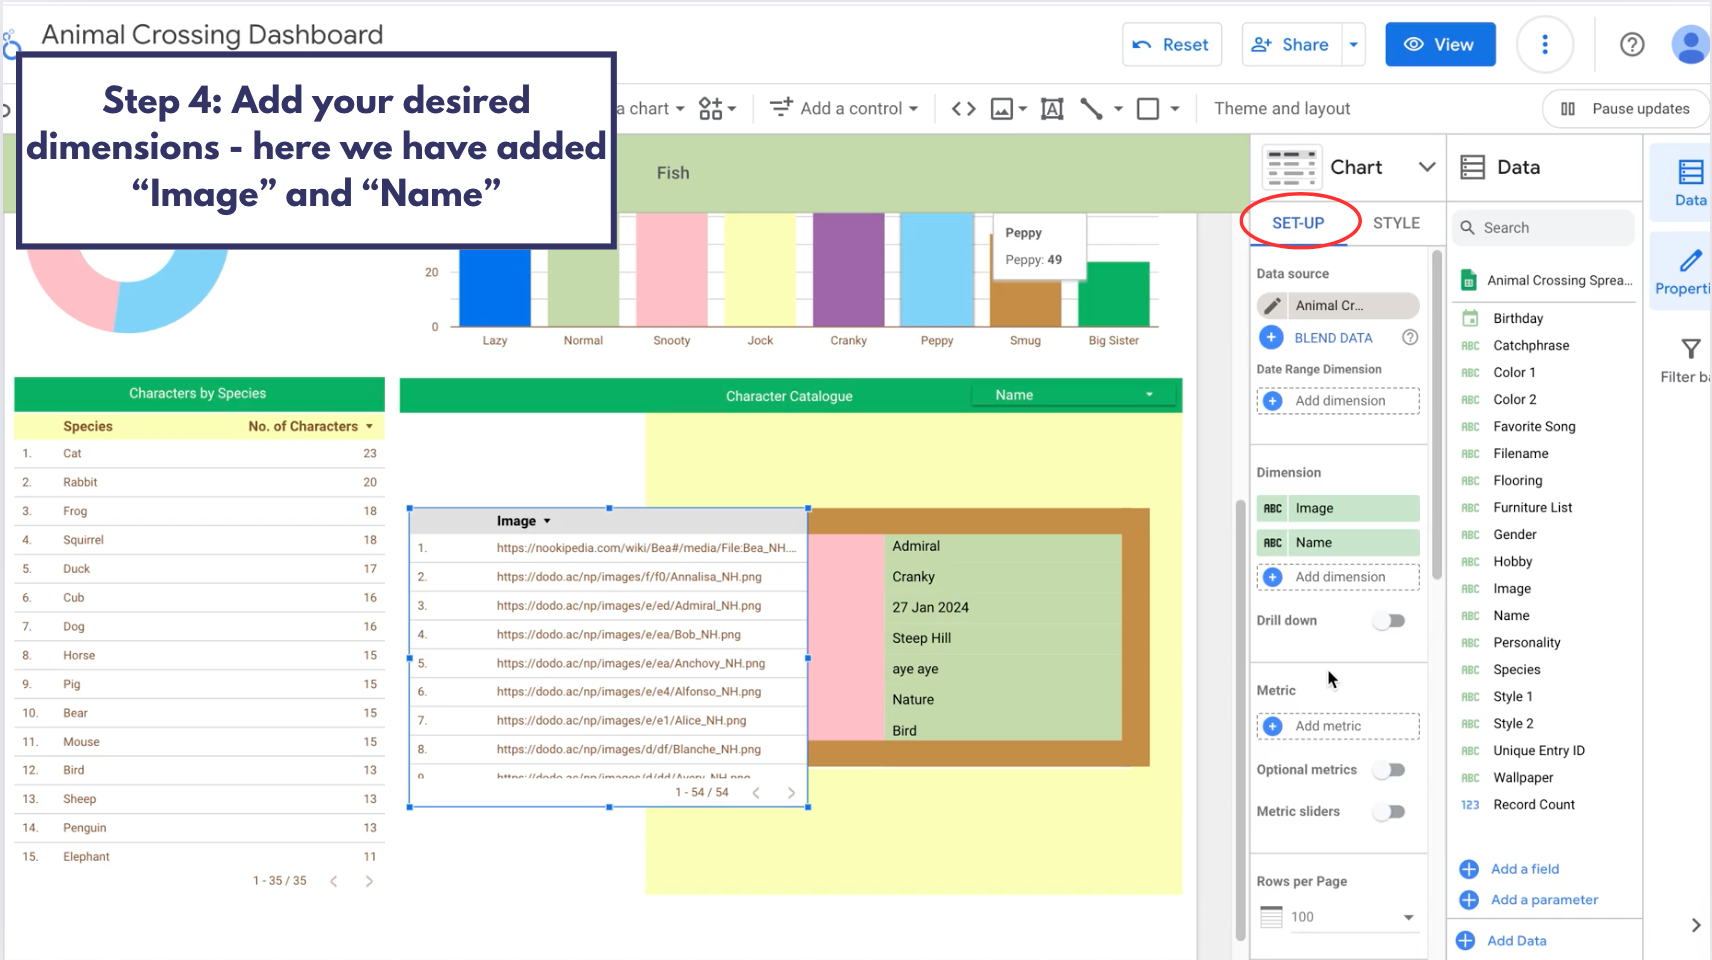
Add your desired dimensions – here we have added “Image” and “Name”.

-
“Sort” by ”Name” in the ascending order – this will allow our images to be presented in alphabetical order.
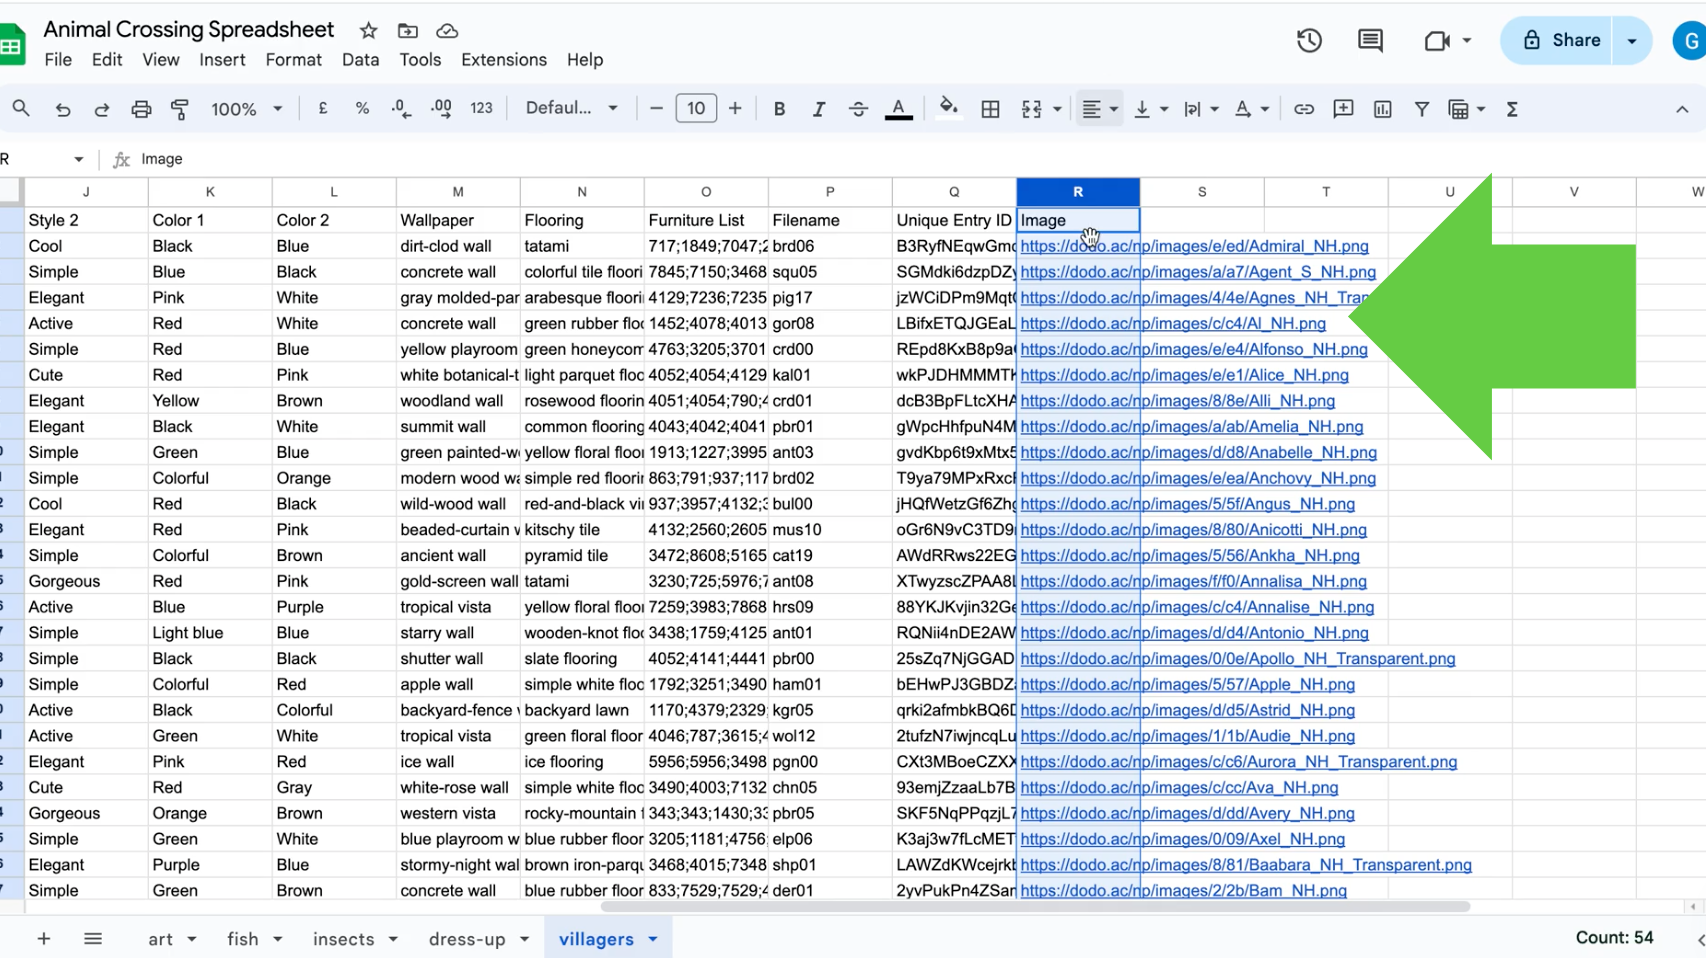
The image values will likely first be populated as URLs as this is how they are presented in the underlying data set (in this case google sheets – see image below)
This “Sort” technique is the most applicable for this data set, your data set may need to be sorted differently to allow it to appear in the most appropriate manner.

-
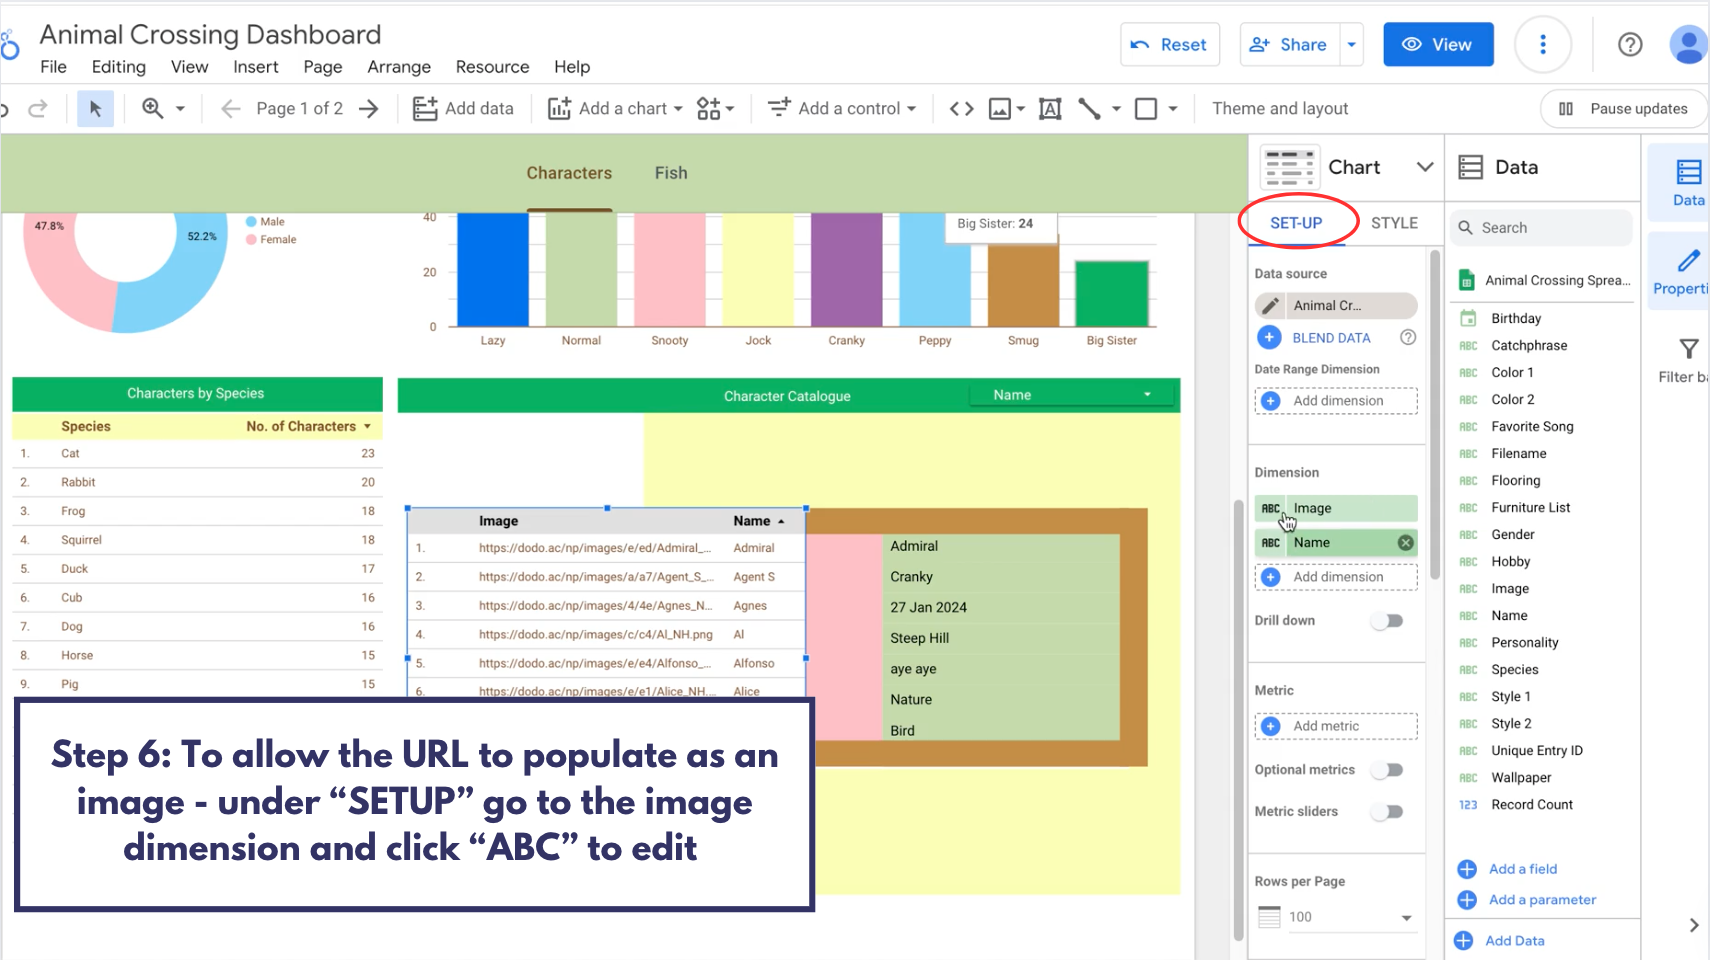
To allow the URL to populate as an image – under “SET-UP” go to the image dimension and click “ABC” to edit.
-
Change the “Data Type” from URL to “Image”.

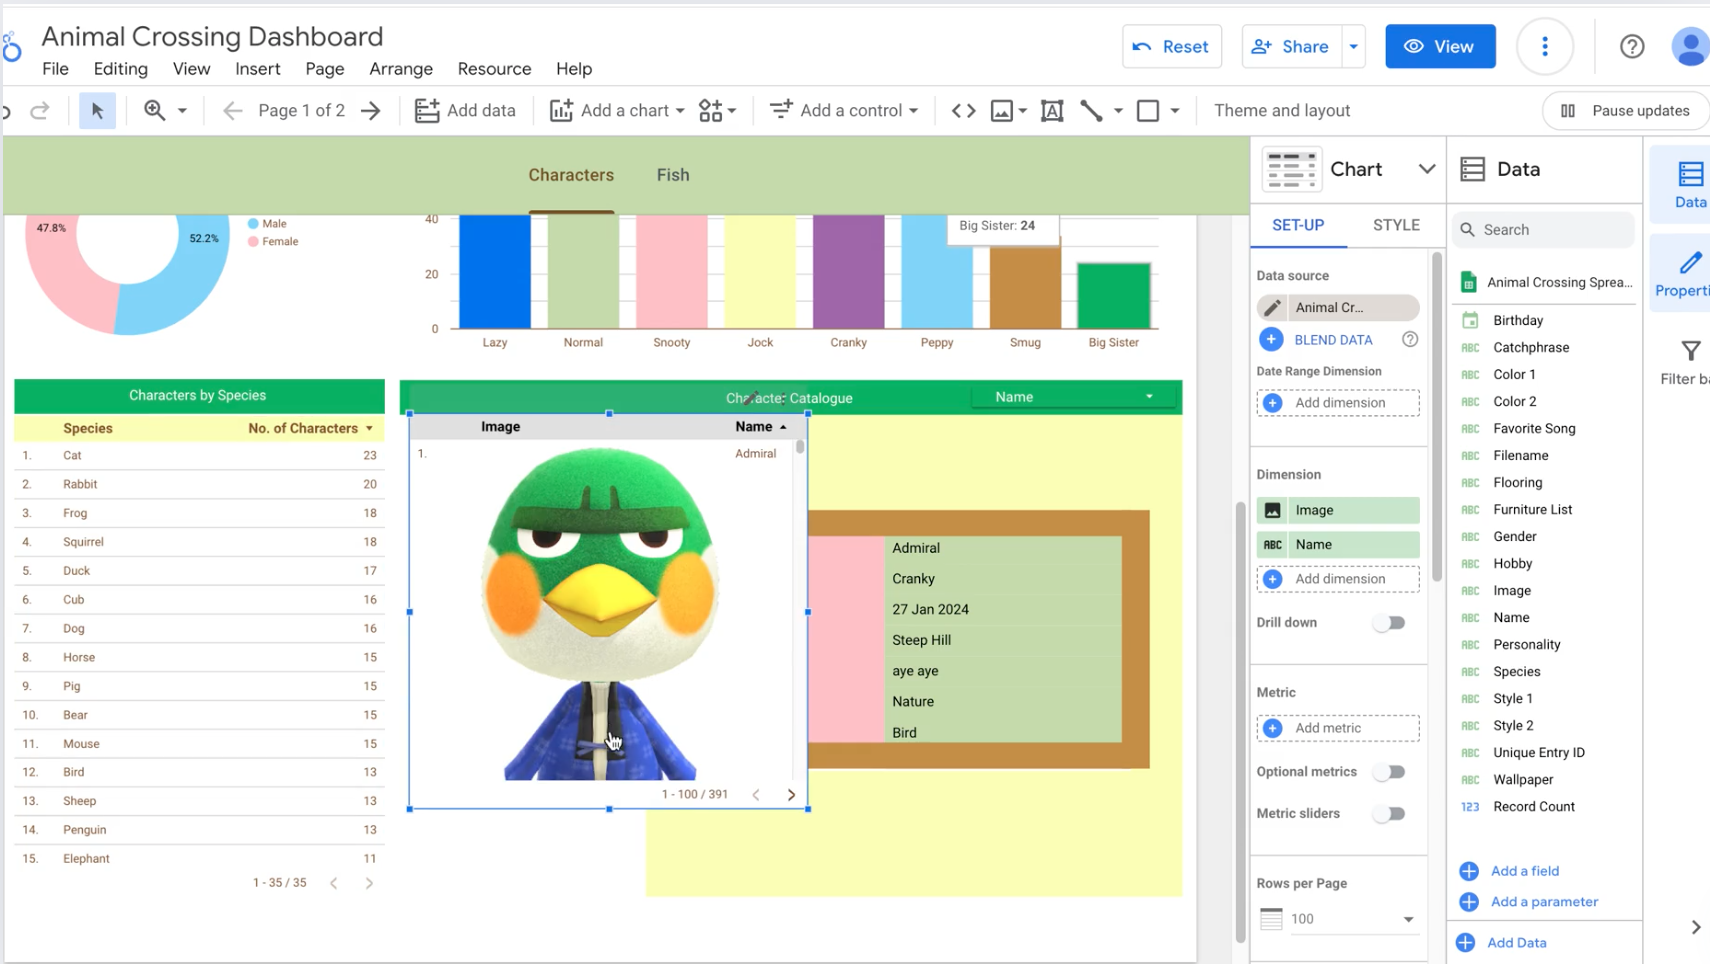
Now your table should be populated with actual images! Remember to adjust the table size and formatting for a cohesive dashboard design.

")